Alcyone Astronomical Software - ephemeris software, astronomical tables, solar eclipse calculator
Alcyone Lunar Calculator - Program Modules
Software > Alcyone Lunar Calculator
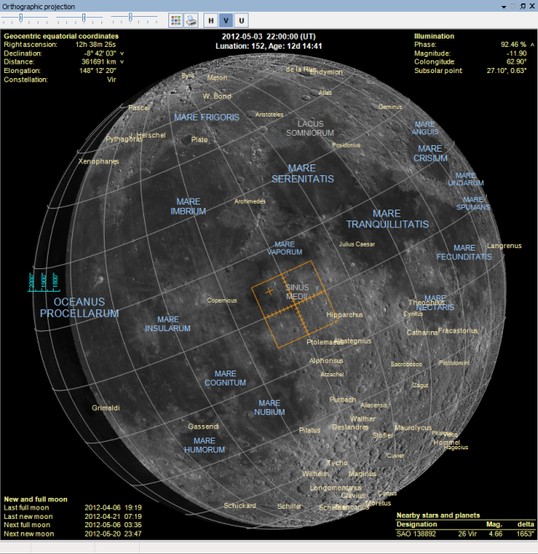
The Orthographic Projection
The orthographic projection shows the visual appearance of the lunar disc as seen by an (fictional) observer at the center of the Earth (in geocentric mode) or as seen from an observer at the surface of the Earth (in topocentric mode) at the observation time. The projection is created with respect to the illumination of the lunar surface by the Sun and corrected for geocentric / topocentric libration and and the parallactic angle (in topocentric mode). The projection also allows the visualization of eclipses, occultations and appulses.
In the projection lunar features are labeled according to the nomenclature provided by the NASA Catalogue of Lunar Nomenclature (NASA Reference Publication 1077).
Data panels display additional information on the Moon, e.g. positional or physical ephemerides, times of lunar events, local circumstances of eclipses, nearby stars, planets and more.


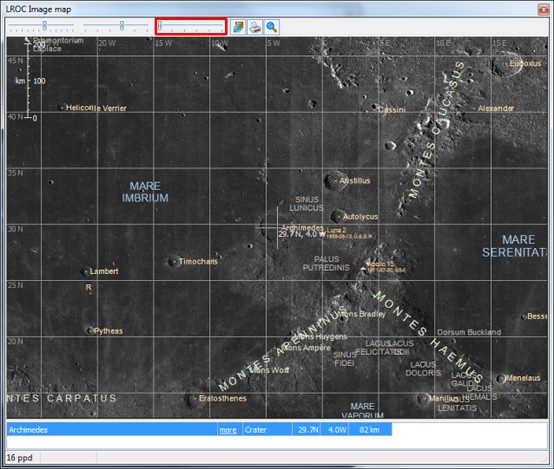
The LROC Imape Map
The LROC image map program module provides an interactive image map of the lunar surface in plate carée projection. The map is based on images taken by NASA's Lunar Reconnaissance Orbiter Camera (LROC). The image is currently available in five resolutions (zoom levels): 16, 24, 32, 48 and 64 pixels per degree (~1895 .. 474 meters per pixel in latitudinal direction).
In addition elevation maps and 3D models of lunar features are available.
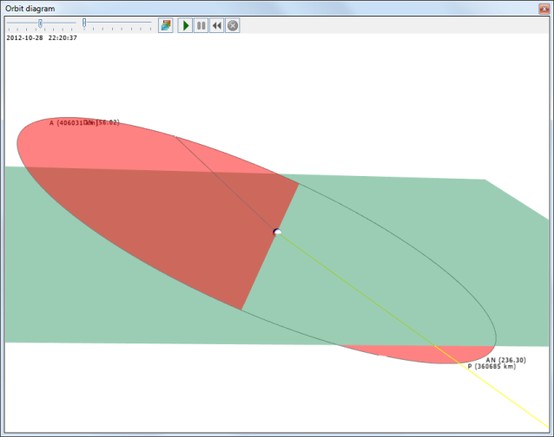
The Orbit Diagram
The orbit diagram program module shows a three-dimensional geocentric visualisation of the lunar orbit. It shows
- the positions and rotation of the Moon and Earth at the obsvervation time
- the lunar orbit for a time range of one mean synodical periodthe lunar orbital plane
- the ecliptical and equatorial plane
- the Earth-Sun direction
- the Earth-Moon direction
- the rotational axes of the Earth and Moon
- the shadow cones of the Earth and Moon in the case of lunar or solar eclipses.
The orbit diagram can be zoomed, scaled, rotated, printed and exported.
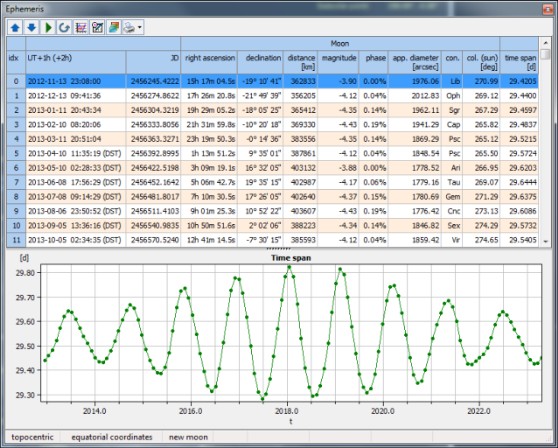
The Ephemeris Program Module
ALC contains an accurate and fast astronomical ephemeris calculator covering the period AD 1200 to 2100. It calculates positions of the Moon, Sun, planets and fixed stars in ecliptical, equatorial, and horizontal coordinates, with corrections for parallax and refraction; angular separation (between the Moon and a reference body), distances, apparent diameter, magnitude and phase. The positions and distances are calculated as geocentric or topocentric data, depending on the operating mode. In orbit view mode no ephemeris calculation is possible.
By default, the ephemeris calculation is performed for the Moon only, but a reference body (the Sun, a planet or a fixed star) can be specified, for which also ephemeris data and angular separation from the Moon are calculated. In addition the ephemeris module offers plotting ephemeris data (as a function of time), data export (Excel, CSV), and printing. Access to the complete Bright Star Catalogue and calendar conversion are available.
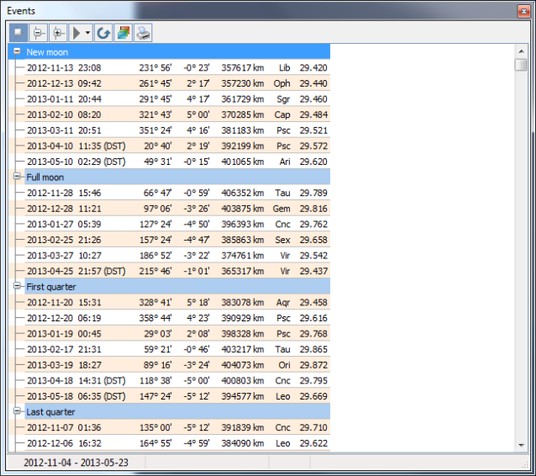
The Events Program Module
This program module calculates the instants and circumstances of lunar events:
in geocentric and topocentric mode
- new and full Moon
- first and last quarter
- apogee and perigee
- passages through the nodes
- maximum northern and southern declinations
in topocentrc mode
- first and last lunar visibilities
- occultations and appulses of bright stars (up to 6th magnitude) and planets
- lunar and solar eclipses
- rise, set, and culmination times
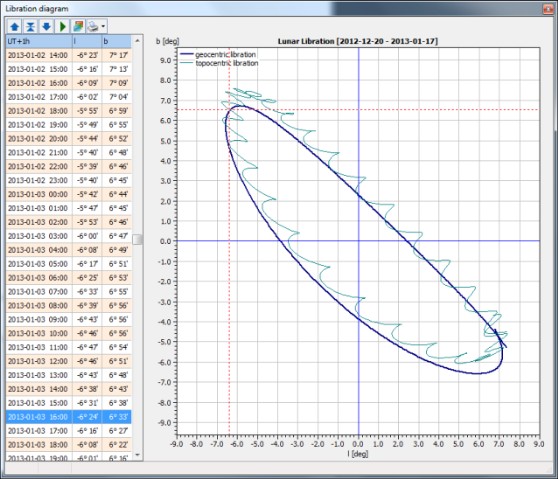
The Libration Diagram
The libration diagram is calculated for the time range of 28 days as a parametric representation of the geocentric / topocentric libration in longitude l (horizontal axis) and libration in latitude b (vertical axis) with the time as the parameter. In addition the values of libration in longitutude and latitude are tabulated in steps of 1 hour.
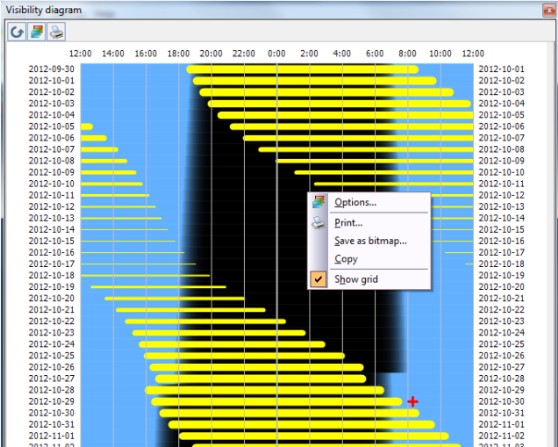
The Visibility Diagram
The visibility diagram is calculated for the time range of 60 days. The vertical axis shows the date and the horizontal axis the time from 12:00 to 12:00 of the following date. The background color of the diagram show when the Sun is below the horizon (black), above the horizon (blue) or near the horizon (shaded). In each row the times when the Moon is above the horizon are marked by a line (yellow). The thinkness of the line indicates the lunar phase (the thicker the line, the greater the phase).